BLOG
|
15.02.2025
NEW DESIGN, NEW FUNCTION - PART 3: INVENTORY
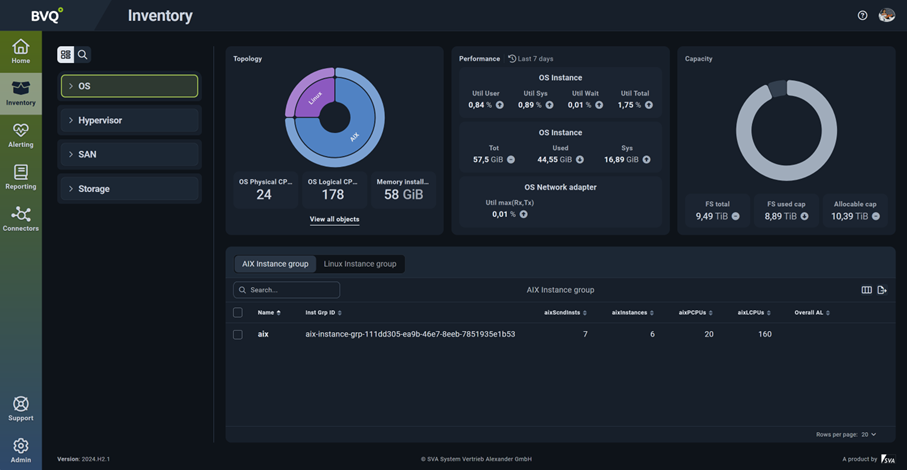
With the INVENTORY in the BVQ° Release 2024.H.2.x, a new central component for managing and controlling the environment has been introduced in the BVQ° Server. Important information about the platforms and systems scanned with BVQ° is provided here, divided into the respective platform layers, as inventory with further subdivision options. The inventory acts as a complete directory, allowing you to easily locate any object in your scanned infrastructure and access detailed information about each one.
ADVANTAGES OF THE BVQ° INVENTORY FUNCTION
- Display of all known objects of the respective systems in tabular form
- Linking of objects to visualize the current health status, including monitoring using BVQ° Alert Rules
- Availability of basic performance and utilization metrics, including visualization
The inventory thus provides a comprehensive insight into the infrastructure as well as object-specific details and represents a first milestone in the integration of the expert GUI into the BVQ° web interface. This paves the way for extended analysis functions in future versions.
Fig. 1: Basic presentation of the inventory
STRUCTURE AND BENEFITS OF THE NEW INVENTORY
The functionality compared to the previous BVQ° Server version has been significantly improved by the integration of the inventory. Below we provide an initial overview of the respective representations and possibilities and briefly explain them.
The design of the new inventory within the BVQ° UI is divided into three main areas, as marked in the following figure:
- The blue area includes the subdivision of systems and platforms below their respective OS, hypervisor, SAN, or storage layers. This can be expanded as a tree table or searched using the search function.
- The green border shows the current representation of topology, performance, and capacity values related to the object selected in the blue area. Furthermore, you can access the detailed view of the selected system via the "View all objects" link.
- The yellow section represents a table with objects and their metrics, based on a predefined selection for the chosen object, which can be adjusted if necessary.
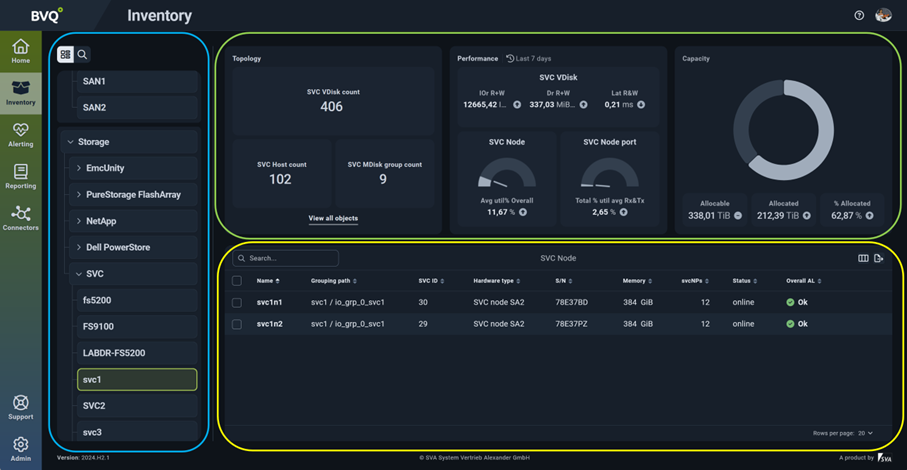
Fig. 2: Focus areas of the Inventory
TIPS FOR THE SEARCH FUNCTION IN THE BLUE AREA
To quickly find a desired object, such as a cluster, host, or switch, two different alternatives are available:
- simple navigation in tree mode
- search in search mode
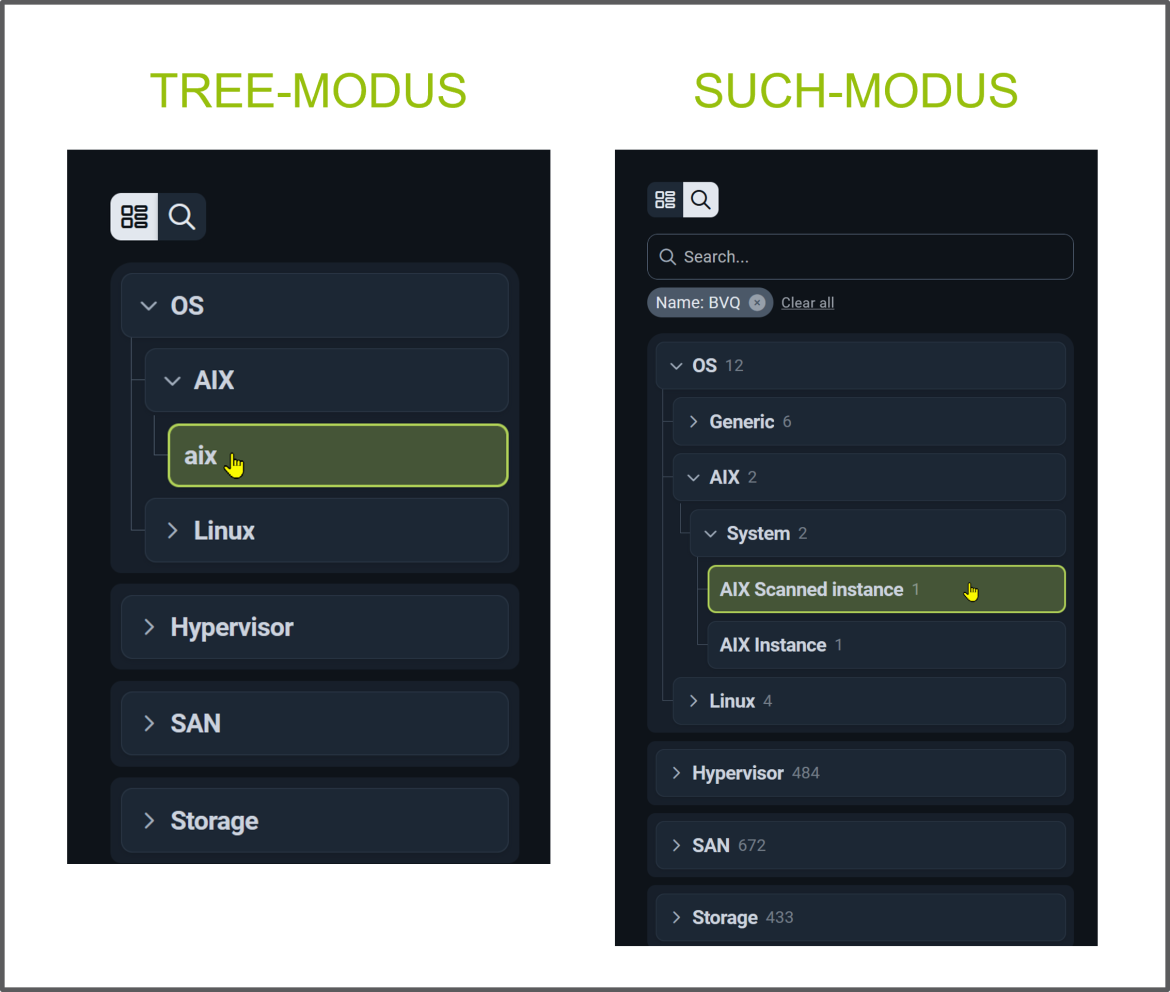
Fig. 3: Search Function in Inventory
- The tree mode allows expanding the layer over the platform to the respective system. There you can select the system of choice as a "grouping object," as shown in the example "OS / AIX / aix."
- Alternatively, you can use the search function, as shown in the image. This allows a comprehensive search across all objects with a specific name. Additionally, you can extend the search with the following commands to narrow down results:
- Main grouping object
- Name
- Object type
- Primary grouping object
Tip: If you do not use any of the predefined search criteria and simply start typing, the search will display all results that match either MGO, name, object type, or primary grouping object.
TIPS FOR THE TABLE FUNCTION IN THE YELLOW AREA
In the yellow-marked area (see Fig. 2), the table function of the inventory is shown. The following options are available to you:
- Each table view can be expanded for each selected object via the "Manage Columns" menu (here: green)
- The search function offers a direct search of the metric (here: purple)
- The selection can optionally be made via checkboxes in tree mode (here: orange)
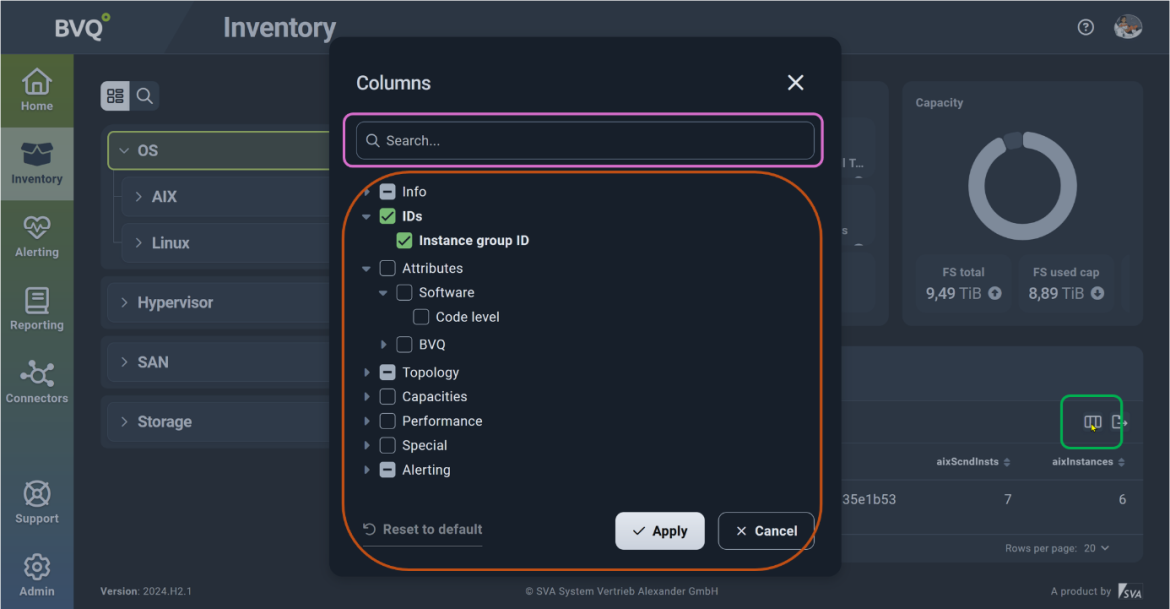
Fig. 4: Table view and setting
TIPS FOR THE DETAIL VIEW IN THE GREEN AREA
In a further view of the green-marked area (see Fig. 2), the detail view of all objects contained in a "master grouping object" can be accessed via the "View all objects." Here, the two functions "search" and "table" from the previously mentioned areas are used and applicable analogously.

Fig. 5: Detailed view of a master grouping object
CONCLUSION
With the inventory, a powerful extension has been built into the BVQ° Server, giving every user the ability to better monitor their environment. The structure, distribution, and key performance metrics are applicable and usable here. The health status of each object can also be checked and displayed. The direct connection of objects with BVQ°'s own alerting enables this direct interaction.
WHAT COMES NEXT?
Many important new functions and possibilities have been built into the BVQ° Server. Interested parties can look forward to the next blog articles with valuable details on the following features:
- LDAP integration
- Documentation
- Targeted creation of rules and reports
- Tagging
- Search function in all areas
If you have any questions about the new BVQ° Server UI or the various setting options, please contact us. You can find more details and further blog posts on our BVQ° WIKI.